
Trim the Tail! Understanding Lead Time Distribution with Kanban
What is lead time distribution?
The inconvenient truth is that lead time is not a single number, rather it is a random number defined by a probability distribution function. The good news is that by recognizing the shape of the lead time distribution, we can learn a lot about the nature of the work and the delivery risks associated with it. This enables us to make effective risk-management and planning decisions that provide for a reasonably optimal economic outcome given the uncertainty involved.
The figure shows a histogram of lead time data from a real kanban system implementation. The x-axis shows the number of days of lead time and the y axis shows the number of occurrences of that time within the sample data set (the number of items pulled through the kanban system).
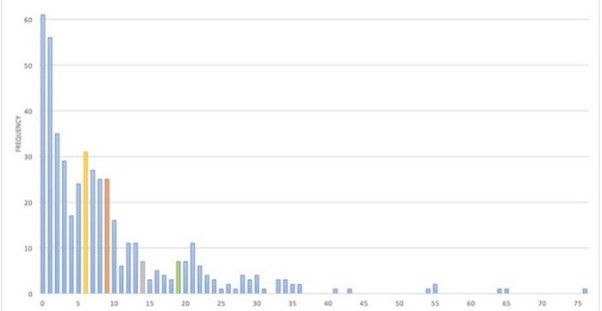
This lead time distribution comes from an IT operations group. It is said to be fat-tailed. That means there is a long, visible tail stretching out to the right along the x-axis. Generally speaking, a fat-tailed lead time distribution is undesirable, risky, and makes planning difficult.
The mode is the top of the hill, the most commonly occurring lead time in the data set. The psychological impact is that it is the most memorable. If the mode is 15 days and you ask someone how long things typically take, they are likely to answer that it is usually around 15 days because this is the most memorable, dominant result.
The median is the 50th percentile. If the median is 20 days, it means that half of the items processed took less than 20 days, while the other half took 20 or more days (and “more” can always be longer than current 100%).
This leads to the psychological result of “on average, things take 20 days” because half take less than 20, the other half more. When humans use the term “average” to report a phenomenon they experience physically, emotionally, and with their sensory perception and limbic brain, they are almost certainly reporting their experience of the median.
The mean is the arithmetic average: sum up the value of all the data points and divide by the number of points. In plain language, the word “average” is usually used to refer to this arithmetic mean. Humans use this term correctly when they are referring to something they experience as mathematics and are processing with the logical brain, their prefrontal cortex.
Why makes it a fat-tailed distribution?
The mean tends to accelerate away from the mode and the median as the tail extends farther to the right with higher data points (work items with longer lead times). A fat tail affects the mean much more than it affects the median and is unlikely to impact the mode at all.
Understanding this is important for planning, risk management, and customer satisfaction. Planning is affected because simple forecasting equations, such as Little’s Law, require using the mean. Just a few high-value data points skew the mean upward may dramatically affect the accuracy of a forecast.
“The risk is always in the tail.”
It is important to remember this simple mantra, “The risk is always in the tail.” Fat-tailed distributions require a different approach to managing risk.
Why should trimming the tail should be our first improvement action?
Fat tails affect customer satisfaction
The impact of a single long lead time, a single high-value data point, can destroy customer trust. In the example above, the most common response time is the same day, the next most common is “tomorrow”, and the next “the day after tomorrow”.
As a customer, I ask, “When will my request be ready?” and I am told, “We usually process items in one to three days.” I then wait 77 days – 25 times longer than I’d been told to expect. Burned by this one bad experience, I no longer trust the service delivery. Consequently, every future request I make will have a deadline attached to it and penalties for failure to deliver.
Fat-tailed lead time distribution carries a significant risk
This risk is not easy to deal with as you cannot use an average. To make an average meaningful you need to gather between 2k and 10k data points. One the other hand, in the thin tailed distributions world you need to collect up to 100 data points to express an average, which will have variance from reality around 10%. And when you are asked: “How many items will you deliver next month?” and on average you deliver 70, then your range will be in between 63 and 77, and your customer will keep trusting you, if you stay within this range.
But if your lead time distribution is fat-tailed, you need 2k-10k data point to achieve that level of convergence.
The guidance
So, the basic guidance is: when you see that your lead time distribution is fat-tailed – solve it first and trim the tail.
When you see that your lead time distribution is fat tailed – solve it first and trim the tail!
If you are a higher-level maturity business and introduce the improvements programs, you should observe your lead time distribution tail shrinking. The practices focused on trimming the tail are mostly Maturity Level 2 and Maturity Level 3 transition.
Of course, there will be domains or business situations where long lead times are inevitable as this is out of their control. Although it’s sometimes impossible to be thin-tailed all the time, mature organizations realize that this is the nature of their business. They anticipate that and prepare the contingency plans and “stop-loss” mechanisms. Lower maturity organizations just get caught with it what negatively affects their business.
SUMMARY
- Lead time is not a single number. It is a random number defined by a probability distribution function.
- The risk is always in the tail.
- Fat tails affect customer satisfaction. The impact of a single long lead time can destroy customer trust.
- When you observe fat-tailed distributions – focus on trimming the tail.
- The practices focused on trimming the tail are mostly Maturity Level 2 and Maturity Level 3 transition.
If you are looking for more planning information, join our classes: