Organizational Maturity & the J-Curve Effect
This is the first in a series of at least four posts about Kanban, evolutionary change and organizational maturity. In this first post in the series, I look at the psychology and impact of traditional large scale managed change initiatives and how evolutionary change differs. We’ll see that organizational maturity and executive tolerance plays a big part in the success or lack thereof in traditional change management. As a consequence, evolutionary change is more likely to succeed with lower maturity organizations. This content has been a staple of the Kanban Coaching Professional Masterclass over the last 6 years. All credentialed Kanban coaches are familiar with these ideas and conversant in their use. If your Agile coach says he/she knows Kanban but can’t explain what follows to you, they aren’t qualified to be coaching Kanban or leading evolutionary change.
A model for organizational maturity
Regular readers of my blog over the past 17 years are familiar with my association with the Software Engineering Institute and my work with the Capability Maturity Model Integration (CMMI). I’ve been a keynote speaker at the SEPG conference. I’ve given the most highly rated talk at that conference on another year. I’ve co-authored technical notes with SEI people and I authored Microsoft’s MSF for CMMI Process Improvement in 2005. I earned the respect of the academics at Cargenie Mellon because I actually understood the underlying idea behind the Capability Maturity Model (CMM) at the SEI – to implement the ideas of W. Edwards Deming for software engineering. The following model is CMMI inspired and hence pays homage to Philip Crosby’s Manufacturing Maturity Model (MMM). However, those knowledgeable with CMMI will note that I’ve made some subtle changes. The purpose of this model is to enable a shorthand method for assessing organizational maturity in a general way, for any business, and without any need for an appraisal or formal assessment.
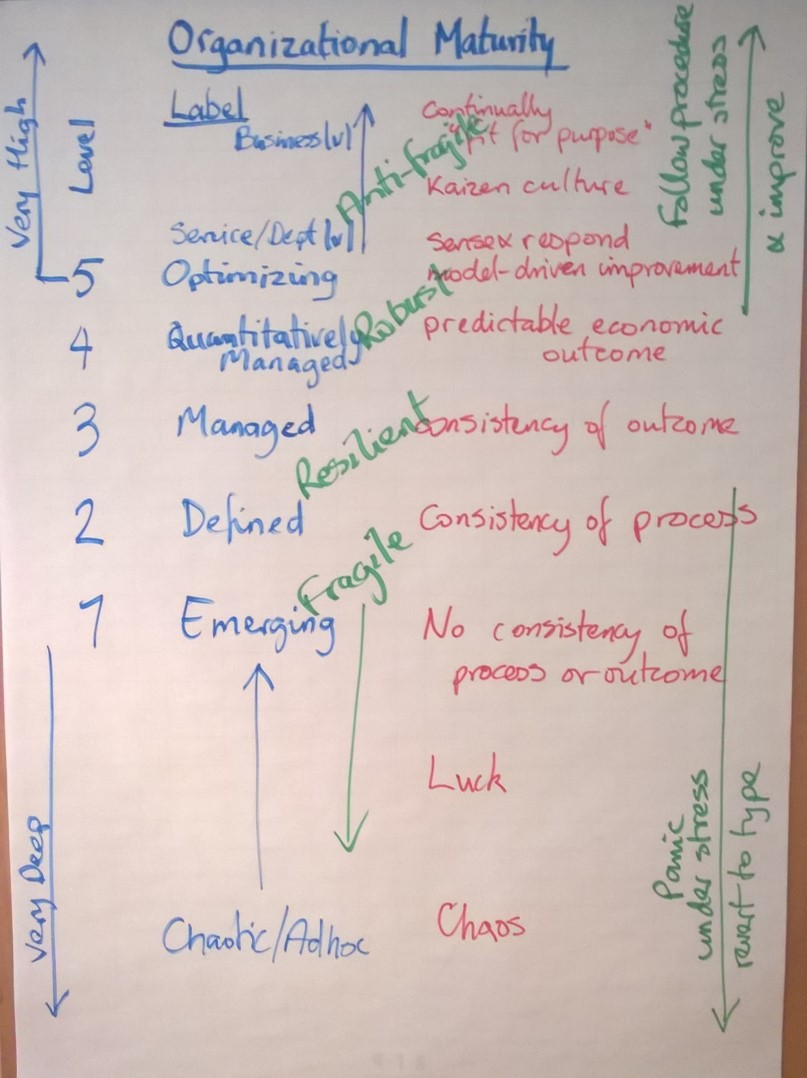
Figure 1. Professional Services Organizational Maturity Model (PSOMM)
Professional Services Organizational Maturity Assessment
Figure 1 showes the PSOMM model, using five levels similar to Corsby’s original MMM and the CMMI/CMM that followed it. The five levels are: Emerging; Defined; Managed; Quantitatively Managed; and Optimizing. While the names are the same at the CMMI, people familiar with CMMI will note the subtle and deliberate reversal of Defined and Managed. I find this change useful for pedagogical reasons. It also seems to make better logical sense – I am sure some academics in Pittsburgh will want to argue about that.
Maturity Level 1
Level 1 describes organizations with emerging processes or service delivery workflows. As the saying goes, at the SEI, “level 1 is very deep”. Level 1 models complete chaos through emerging maturity to almost completely defined processes and workflows. In level one, we observe, the chaos of “everyone for themselves” through functional team coordination, heroic efforts, random luck, and eventually to fairly defined processes and understood workflows. However, some inconsistencies persist. There is still a random element to how service requests are processed and as a result there is neither consistency of process or consistency of outcome. Energy is wasted resolving the lack of consistency of process, and a lack of consistency in how work is handled leads to a lack of consistency in the outcome – both in terms of what is delivered and the quality and consistency with which it is delivered. There is no consistency of product or service or consistency of service delivery. The system is fragile and prone to catastrophic failure. In the lower reaches of Level 1 it is completely unmanaged, nor is there any traceability or governance. The organization will tend to panic under stress and regress to an “everyone for themselves” mode of behavior – structures, workflows and processes will break down. There will be a regression to a craft style of working with heroic efforts occasionally producing useful results at small scale. Coordination of larger groups of people becomes impossible.
Maturity Level 2
At Level 2 we have defined workflow processes. There is consistency of process for a service request of a given type. If we were implementing the workflow using a kanban system and board, we would be able to define the kanban system and use it consistently without rework or workarounds. At level 2 there is an expectation that work is handled in a consistent manner. We might expect quality improvements to both the product or service and the service delivery but there will be inconsistencies in what is delivered and how it is delivered. The system remains fragile and prone to failure. There is now an ability to trace work and report status. As a consequence, there is rudimentary governance of process – the right things are processed in the right way. What isn’t assured is the outcome. Customer expectations will not be met consistently and there is a failure to meet core fitness criteria metrics. Under stress, there is a tendency to break discipline and workflows become erratic. There will be a regression to level 1 maturity.
Maturity Level 3
As level 3 the process workflows are now managed. We see marked improvements in the product or service being delivered and the manner in which it is delivered. There is a consistency of process as well as consistency of outcome. Customer satisfaction grows dramatically as customers find their expectations are being met. We will observe a significant trimming of the tail in lead time distribution and quality metrics such as defect rates. The system is now resilient and can bounce back from stress and adversity. Governance levels have improved and we’d consider the system to be well governed. The right work is processed in the right way with little rework, failure demand or customer dissatisfaction. The funds at risk are now considered well spent – costs are controlled, prices are fair, and customers get value for money. Under stress the organization may exhibit resilience and hold together through the efforts of individual leaders. In the absence of these leaders, there will be a regression to level 2 maturity as consistency of outcome is lost. So there is some reliance on heroic managers to lead the organization in the face of adversity.
Maturity Level 4
At maturity level 4, we see the introduction of quantitative methods for risk management and risk hedging. We aren’t just following a process and producing consistent outcomes, we are now using the data from the process to understand it better. We understand the variation in demand, in service delivery, in product or service quality. We understand business, delivery and technical capability risks that affect outcomes. We understand, track and manage dependencies between cascading service requests. We deploy probabilistic forecasting, mathematical formula, and regression and iterative mathematical modeling techniques such as GARCH and Monte Carlo to provide deeper insight into the nature of work and how to manage for consistent outcomes and customer satisfaction. The system is now robust to stress and adversity because it mostly anticipates problems. When something unanticipated happens the system continues to show resilience and bounces back. The bounce is often faster and the negative impact of an unexpected event or change in external conditions is less severe than we would see at level 3. Under stress the organization holds solid. Processes are followed to deal with stressful situations and unexpected events. The organization remains robust and there is continued consistency of outcome for customers providing the stress isn’t too severe. In the event of severe stress then some consistency of outcome is lost but the organization is resilient and quickly bounces back to normal service levels and consistent outcomes.
Maturity Level 5
Level 5 is an optimizing organization. Level 5 can be very high. We might be optimizing only at the service delivery level, or we may expand to optimize at the product level, the service level, the market strategy and market segmentation level or at the entire business strategy level. At each level we see behavior that is designed to probe complex conditions, sense changing conditions and respond with changes to process, workflow, market segmentation, and strategic position as required. At this level, stress actively catalyzes the organization to improve, to mutate, and evolve. At higher levels of maturity level 5, the organization is capable of complete identity change, abandoning core businesses and adopting a new identity and embracing new core business ventures. The organization is antifragile and can be said to be “continually fit for purpose.”
Learning Organizations
It is important not to mistake maturity level 5 with the concept of a learning organization. If the organization is capable of moving up the maturity ladder then it is a learning organization. Learning can and must happen at all 5 levels. The fourth post in this series will look at what is required to catalyze and provoke progression up through the maturity levels.
The J-Curve Effect
I first encountered the concept of the J-curve effect working at Sprint around 15 years ago while hanging out with executives with business school degrees. I was aware at the time of Jerry Weinberg’s work adapting Virginia Satir’s ideas of change from family therapy and psychology but I never saw them as the same. The y-axis in Figure 2 is shown as an abstract concept but you would implement it with a concrete business metric. The y-axis in Satir’s curve is metaphorical and related to the behavior or identity of an individual. In the tangible, pragmatic, actionable, quantitative world of Kanban, we don’t do metaphors. So I don’t attribute this diagram to Weinberg or Satir.
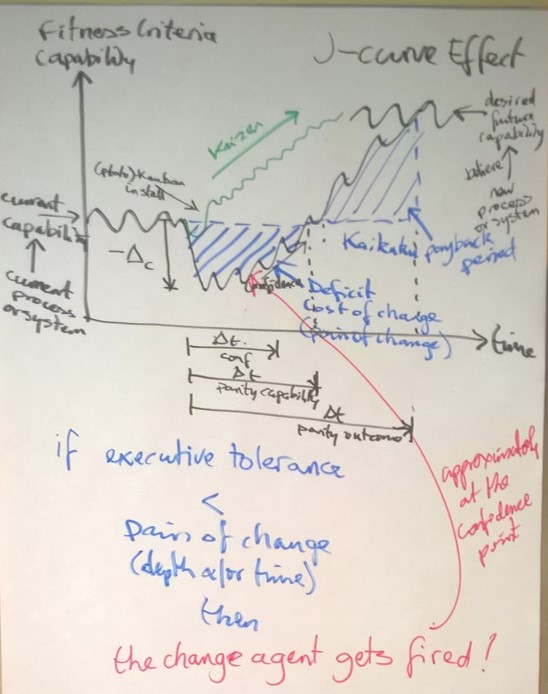
Figure 2. Managed Change J-Curve Effect vs Evolutionary Change
In Figure 2, the y-axis is shown as capability or fitness for purpose, or a specific measure of fitness for purpose such as a fitness criteria metric like lead time. The current capability or fitness level is shown as the oscillating curve on the graph. This level of capability is delivered by the current process and the process is stable. We can assume from this picture that we are dealing with at least a level 2 maturity organization. Stable implies that the mean is stable and we have some natural variation within known bounds, or that the value is trending but in a stable fashion, meaning that the rate of change of the mean is stable and that we still have variation within known bounds. This is a reasonable statement for defined service delivery workflows and is borne out by real data sets captured in real businesses. A capability might be lead time, or quality, or due date performance or percentage performance against an SLA.
The current level of capability is not sufficient and isn’t fit for purpose, so we are motivated to improve. In a traditional managed change initiative, we design a new process intended to achieve the higher level of capability – a level that is fit for purpose. The process may be designed or it may be tailored from a process catalog of defined processes. If we are highly mature, level 4 or above, we probably have models to predict the outcome from the new process. Otherwise, at lower maturity levels, we simply have a belief that the new process will deliver the outcome we seek. We may even consider installing the new process as an experiment but it is rarely one that is “safe to fail” as there is seldom an option to roll back to the old process, given the scale and magnitude of the change.
Once we start the change initiative usually with training and coaching and sometimes with new tools, the current level of capability falls, while our workforce absorb the changes. We can measure the depth of the drop as the negative delta in capability. If things go well then we start to see improvements. Gradually we reach a confidence level that the changes will stick, then we recover back to our previous level of capability, eventually we may achieve the results and pay back the lost outcome with our new improved level of capability. We can measure the time to each of these events from the point where we started. The depth and length of the deficit incurred by the change initiative can be thought of as the pain of change. While we can visualize it as an area, we must also consider the depth and length as two separate parameters. It is the drop in capability and the eventual recovery that gives the concept its name, “the J-curve effect.”
The secret with change management is that the tolerance of our sponsoring executive leadership must be greater than the pain of change. If it isn’t or if our sponsors cannot accept the depth or the time to recover then they will lose their confidence, often panicking, misdirecting with a reorganization, and firing the change agent as a scapegoat.
There is a saying that “no one ever got fired for hiring McKinsey.” The root of this lies in the truth that the McKinsey firm invented this style of designed and managed change initiative. All good consulting firms know that their role and their fee is based on that fact that they will play the scapegoat and take the blame for failure. One of McKinsey’s rivals knows this all too well. During their bootcamp for new graduate recruits, they teach that their business model is to “get to 60% complete and don’t get sued.” This works on the basis that the client is tolerant until 60% complete but if they haven’t reached the confidence point by that time then the initiative will be killed. So long as the consulting firm doesn’t have to fight a lawsuit then they will have a profitable business.
Criteria for Successful Managed Change
Despite the obvious success of large consulting firms practicing this style of change management, the success rates are poor. Typically, about 30% fail and are aborted or reset with a new initiative. Jim Collins described this phenomena, in his book, “How the Mighty Fall,” where they panic in the depth of the J-curve, cancel the initiative, misdirect with a reorg, fire some change agents and start again. This is yet further evidence that such changes aren’t “safe to fail” and aren’t easily rolled back. Some firms get into a death spiral in this fashion. Simply put, they are biting off more change than they can handle and each time they fail they double down by trying again, often with a different consulting firm leading the charge. Only around 10% of such large change initiatives succeed and actually deliver on expectations, the remaining 60% recover, often above the parity capability level but never actually deliver on expectations or produce the return on investment that was anticipated. So why is the failed and challanged rate so high? Why is it that only about 10% of cases succeed? What are the criteria for success?
I have seen large scale managed change work. There are five elements that consistently appear in the stories:
- High Levels of Executive Tolerance (patient, thoughtful, reasoned, and knowledgeable leaders)
- High Organizational Maturity (typically level 4 or above)
- Patient Capital (usually privately held companies)
- Owner Managed (leaders with real skin-in-the-game both financially and emotionally)
- Managers are domain experts (often with decades of experience of the business and a deep understanding of how it works)
So do you have these criteria present in your environment? What are your chances of your organization seeing a large change initiative through to completion and it delivering on its expectations? If they aren’t all that good, perhaps you’d like to consider an alternative, evolutionary change?
Evolutionary Change
The Kanban Method is an approach to change that is designed to work in low maturity organizations with low levels of executive tolerance. It is the “start with what you do now” approach to change. The green line in Figure 2, is drawn to show a small J-curve initially. This represents the installation of a kanban system. The idea is to implement the most sophisticated kanban system design you can get away with without running into significant resistance to change. The judgment on this is taught in the Kanban Coaching Professional Masterclass, and any KCP (Kanban Coaching Professional) can be expected to have this judgment and skill. So-called, proto-kanban systems, degenerate kanban implementations which feature visualization and workflow but without WIP limits, or a pull system, represent smaller J-curves with less impact initially. The idea is to install the mechanism for evolution, to add the evolutionary DNA to the organization then let it work. The series of small j-curves represent small, evolutionary changes, or process mutations. These are known in Japanese industrial engineering as “kaizen events”. A Culture of Kaizen – a culture of continuous improvement – is an attribute of a high maturity organization. In a kaizen culture change is often experimental and the experiments are small enough to be “safe to fail.” Changes can often be rolled back if they prove unsuccessful, producing a negative impact on capability. A series of evolutionary changes will often achieve more in less time than a large scale change initiative. Evolutionary change does this at lower risk than traditional large scale designed and managed change. It has a far greater chance of success across a much wider range of organizations.
Read More
Part 2: Patterns of Kanban Maturity
Part 3: Kanban Patterns & Organizational Maturity
Part 4: Driving Evolutionary Change with the Kanban Method
Learn More
If you would like to learn more about coaching evolutionary change using the Kanban Method, take the Kanban Coaching Professional Masterclass from Lean Kanban University. Classes are coming up in the spring in Israel and Ireland. See listings for details…