Unlocking Efficiency: A Guide to Lead Time Analysis and Improvement
Lead time – a critical metric that provides insights into the efficiency and predictability of your workflow. In this article, we’ll explore how to harness lead time information, collect and analyze relevant data, and implement improvements to enhance your processes.
Step 1: Collecting Data
If you haven’t started collecting lead time information, now is the time to begin. Whether you use physical tools like whiteboards or electronic systems, ensure you have data on start and end dates. Define these dates clearly to avoid misunderstandings, especially regarding when an order is placed, work begins, and the project is completed.
Most electronic tools likely capture this information automatically but double-check the settings to confirm. Consistency in understanding start and end dates is crucial for accurate analysis.
Step 2: Understanding Lead Time Components
Before diving into analysis, it’s essential to grasp the three key points in the delivery process:
- Order Placement: When the customer initiates the request.
- Work Commencement: The start of working on the item.
- Delivery Completion: When the work is finished and delivered.
The lead time is the duration between the start of work and delivery. Clear communication and alignment on start dates are vital, especially when there’s a delay between order placement and work initiation.
Step 3: Analyzing Lead Time Data
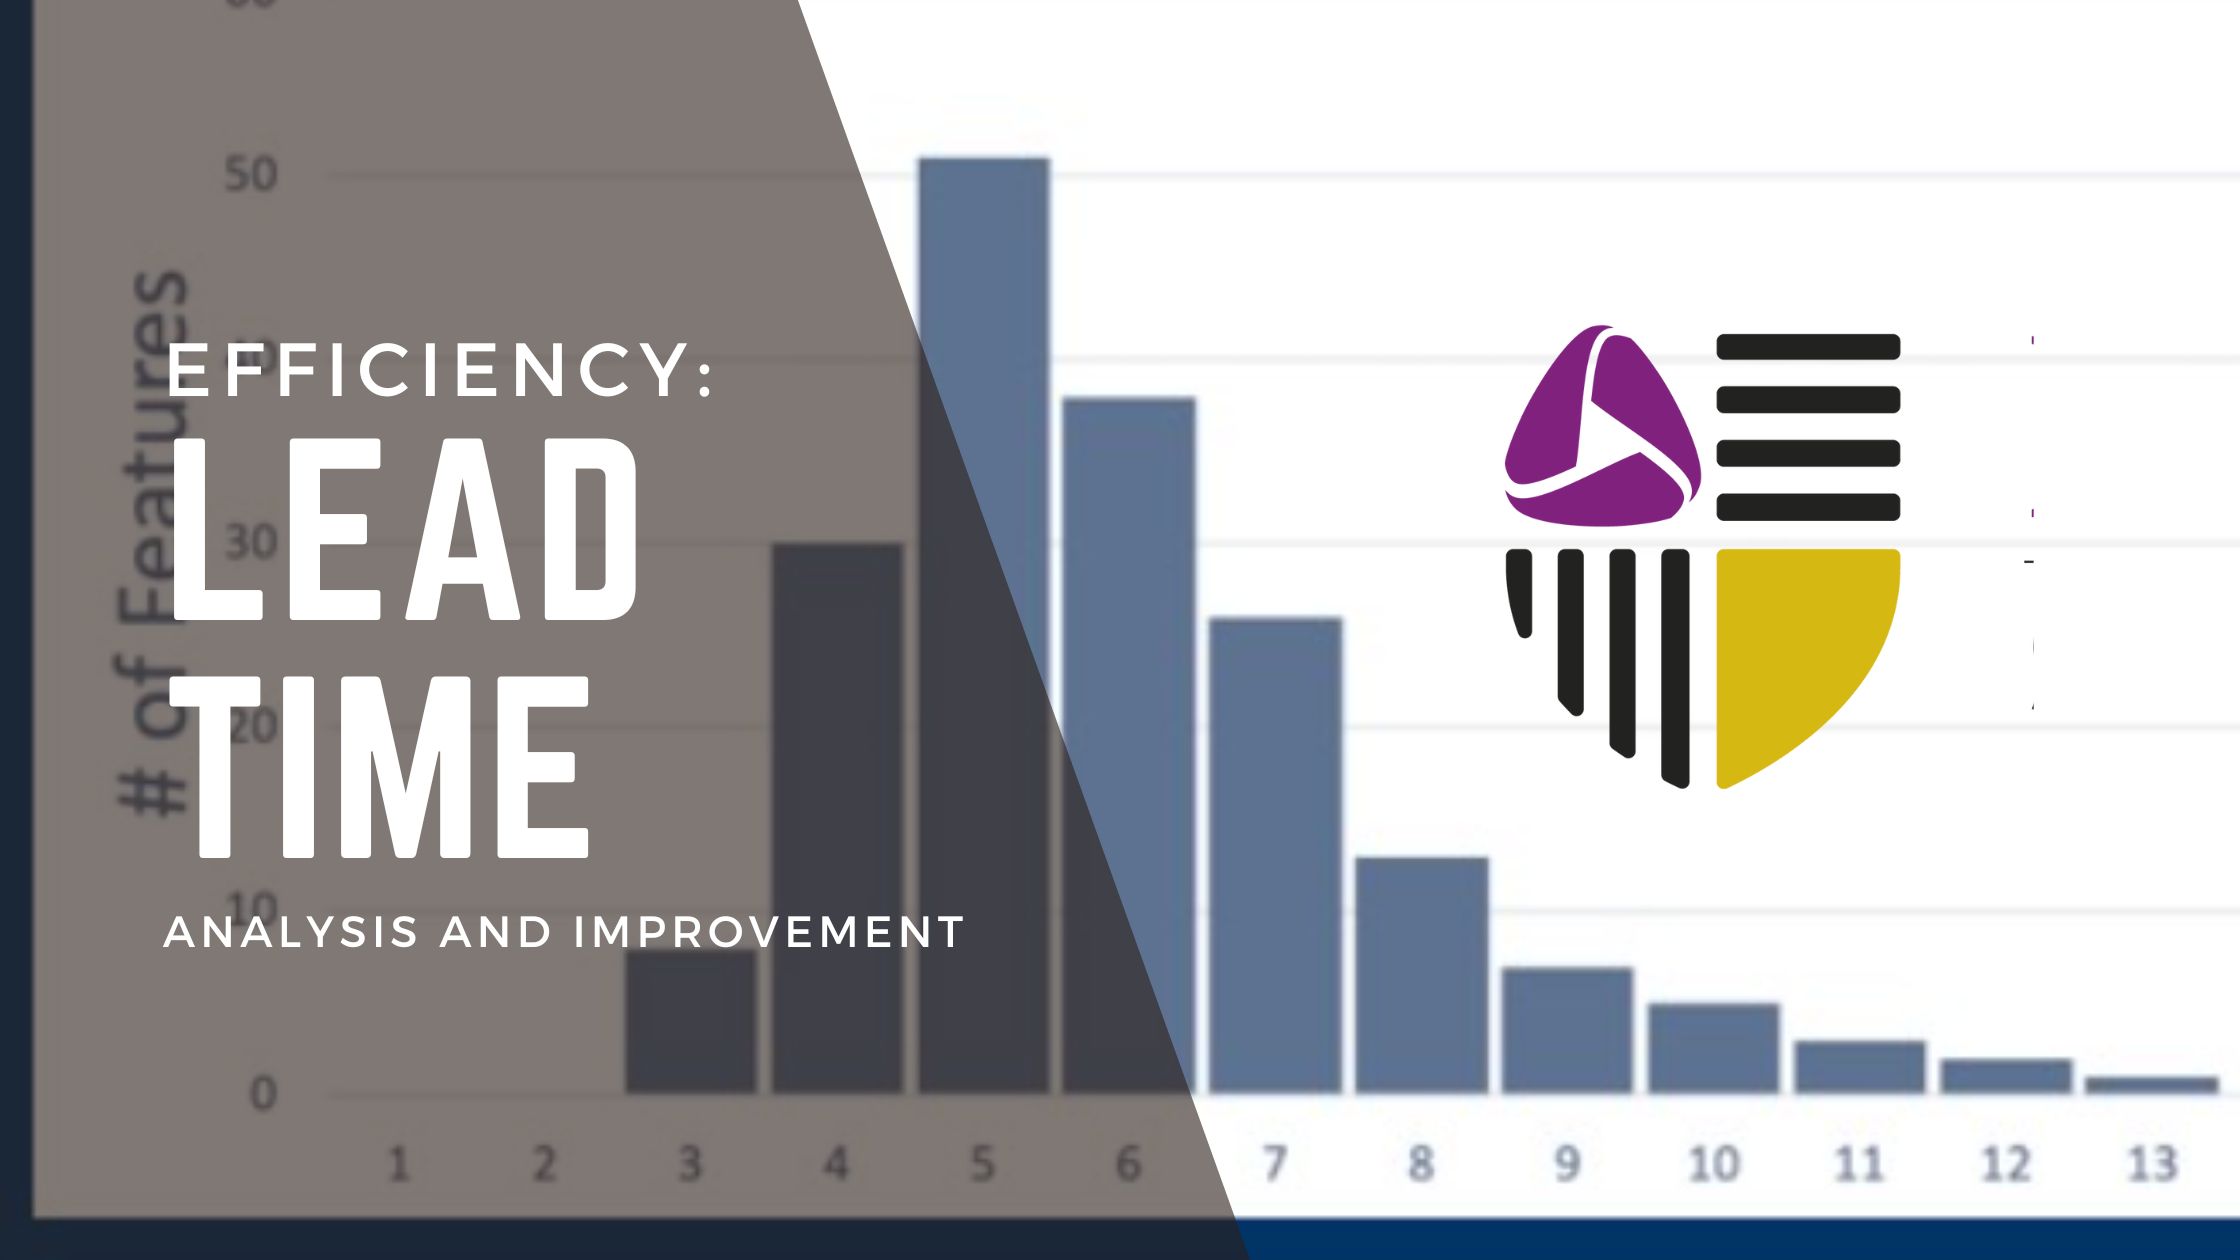
With your lead time data collected, it’s time to analyze it. Utilize tools like Excel or specialized applications to create visual representations of your lead time distribution. Identify the mode, mean, median, tail, 98th percentile, and optionally the 85th percentile.
Distinguish between thin and fat-tailed distributions by comparing the tail to the median. A ratio greater than 5.6 indicates a fat-tailed distribution, while a lower ratio suggests a thin-tailed distribution. Comparing current and past distributions helps track changes over time.
Step 4: Designing Improvements
The crux of lead time analysis lies in designing effective improvements. Focus on outliers – items in the tail of your distribution that take significantly longer to deliver. Cluster similar root causes for delays, such as dependencies on specific teams or extended approval processes.
Prioritize the most impactful or easily solvable root causes for initial improvements. Addressing these issues incrementally allows for quicker progress and builds trust among both colleagues and customers. Tackle more complex root causes once initial improvements are implemented.
Step 5: Outcomes of Improvement
Every improvement should have clear outcomes. Examples of positive outcomes from lead time improvements include:
- Shorter delivery dates for clients and reduced internal waste.
- Decreased waiting time, enhancing work progress visibility.
- Improved customer trust and satisfaction.
- Higher predictability, aiding in better planning.
- Reduced urgency for items, as long lead times often prompt expedited requests.
Step 6: Integration into Improvement Meetings
Incorporate lead time analysis into your regular improvement meetings and retrospectives. Allocate time to review and plan improvements based on data, fostering a data-driven approach rather than relying solely on observations. This ensures targeted enhancements in areas where the process is weakest.
Frequently Asked Questions
- How many data points do I need? Aim for between 11 and 30 data points for a reliable analysis. More data points enhance the accuracy of your insights.
- How often should I analyze lead time? Ideally, conduct lead time analysis at least once per month. However, adapt the frequency based on your delivery cycle and the number of data points available.
- How time-consuming should items be for analysis? While a general recommendation is once per month, align the frequency with your process, cycle times, and data collection capabilities.
By implementing these steps, organizations can unlock the potential of lead time analysis, fostering a more efficient and predictable workflow. Regular analysis and improvement become integral components of a dynamic and adaptive process.
Learn More About Metrics
Register for the self-paced learning course Actionable Metrics to discover how to measure and improve using the correct metrics.